Gold wasn’t completely immune to the recent financial market sell-off, yet its relative performance versus other major assets remains impressive. What’s more, there are enough signs that safe-haven demand for the metal is strong enough to warrant significantly higher prices in the months in the wake of pandemic-related global economic worries.
After a brief bout of panic selling, gold prices are attempting to stabilize this week as the equity market struggles to discount the effects of COVID-19. The front-month gold futures price hit the $1,450 level intraday on March 16, its lowest point since last November. The $1,450 level is widely regarded by technicians as a benchmark “support” level for the metal, so the latest successful test of this support can be regarded with relief since the level remains unbroken to date.
What’s more, gold recovered above its psychologically significant 200-day moving average on March 17 after briefly dipping below this widely-watched trend line earlier in the week. Only once in the last year has gold fallen below the 200-day MA, and it hasn’t done so on a weekly closing basis since 2018. Basically, the gold bull market that was launched in late 2018 has been confirmed by the 200-day trend line throughout its journey, and as long as it remains intact on a weekly closing basis, I regard gold’s dominant intermediate-term (3-6 month) trend as being controlled by the bulls.
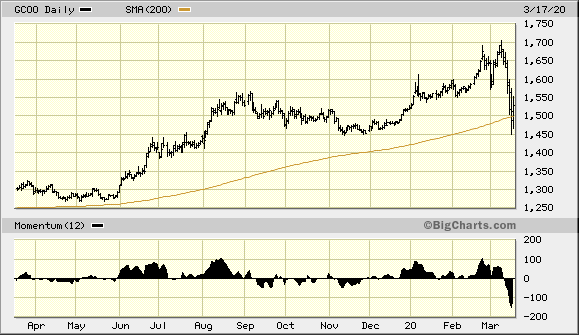
Source: BigCharts
More importantly, gold continues to enjoy a decisive relative strength advantage over virtually all other commodities right now. As I’ve emphasized in past reports, gold’s relative performance versus stocks, bonds and inflation-sensitive commodities like crude oil is of paramount importance since asset managers typically consider these factors before making capital allocation decisions involving gold.
The first consideration when evaluating gold’s technical position is how well it’s performing compared to the broad U.S. stock market. Shown here is the gold price versus the S&P 500 Index (SPX) ratio; it’s clear from this that gold is massively outperforming versus equities. While it may seem unimportant to some, this is a big feather in gold’s cap since it makes gold virtually the only game in town (from the perspective of defensive-minded investors) aside from sovereign bonds.
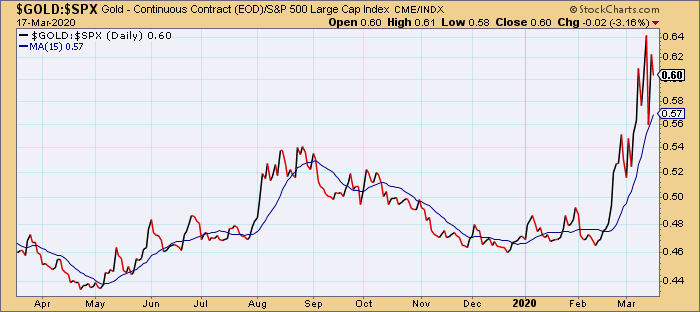
Source: StockCharts
The next chart exhibit underscores gold’s performance versus crude oil as seen through the lens of the iPath GSCI Crude Oil Total Return Index ETN (OILNF). This chart is another feather in gold’s cap in that it shows not only is the metal decisively outperforming oil, but it illustrates the extent to which deflationary undercurrents are being felt throughout the global economy. The mere threat of deflation is one of gold’s strongest selling points, for when investors are worried about falling commodity prices they typically flock to gold as a hedge against deflation. With the stench of deflation thick in the air right now, the demand for gold as a safety hedge is high indeed.
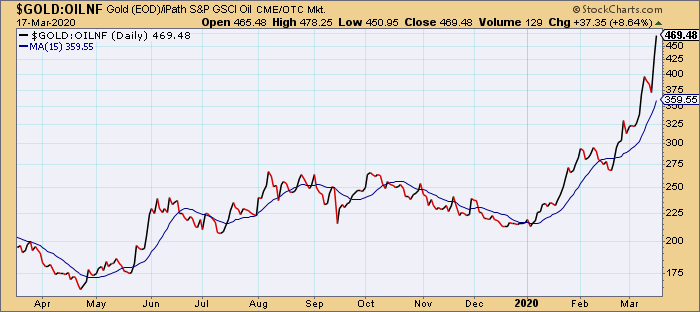
Source: StockCharts
The only major area where gold’s relative performance is lagging right now is in its comparison with U.S. Treasury bonds. Below is a ratio chart comparing the gold price with the iShares 10-20 Year Treasury Bond ETF (TLH), my favorite long bond proxy. Just a few weeks ago, gold was outperforming T-bonds in relative terms. However, the latest selling panic in equities sparked a massive move into Treasuries while gold suffered some liquidation pressure as investors indiscriminately sold anything they could to quickly raise cash.
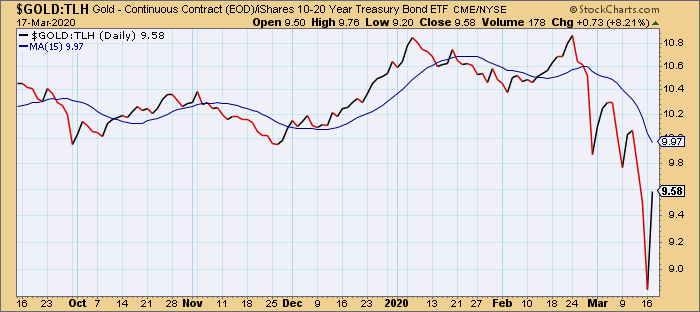
Source: StockCharts
When gold falls along with everything else in a selling panic, however, the selling pressure on gold tends to be short-lived. Once investors regain their wits and realize that they threw the proverbial “baby out with the bathwater,” they typically return to buying gold as safety demand is always highest in the wake of a financial market crash.
With gold trying to establish a bottom, moreover, gold’s performance versus Treasuries is likely to show improvement in the coming weeks. But even considering its relative weakness versus T-bonds right now, the metal is still outperforming two out of three of its major competitors. That’s enough to commend gold as an ideal safe-haven asset to own in the coming months since the global economic outlook remains very uncertain.
On a side note, I’ve always found it comforting when Goldman Sachs agrees with my intermediate-to-longer-term gold price outlook. This is due to the high regard with which I hold Goldman’s commodity chief, Jeff Currie, as he has a very respectable record in forecasting gold’s longer-term price trends. On that note, I was gratified to hear that Goldman has released a research note which confirms the investment bank’s previous 12-month price target of $1,800/oz. If realized, this would mean gold prices will advance by 17% from current levels in the next several months. Goldman stated:
We maintain our bullish outlook on gold, as the larger-than-expected shock to the global economy will likely lead to greater risk aversion.
In summary, gold’s intermediate-term bullish outlook appears to be assured in view of its continued safety-related demand among investors, as well as its relative strength versus two of its three major competitors, namely equities and crude oil. Lingering worries over the impact that COVID-19 will have on the global economy should allow gold to maintain support above the pivotal $1,450 level and, eventually, boost gold prices to new multi-year highs later this year. Bullish longer-term investment positions in gold are still therefore warranted.
Clif Droke – Seeking Alpha – March 19, 2020